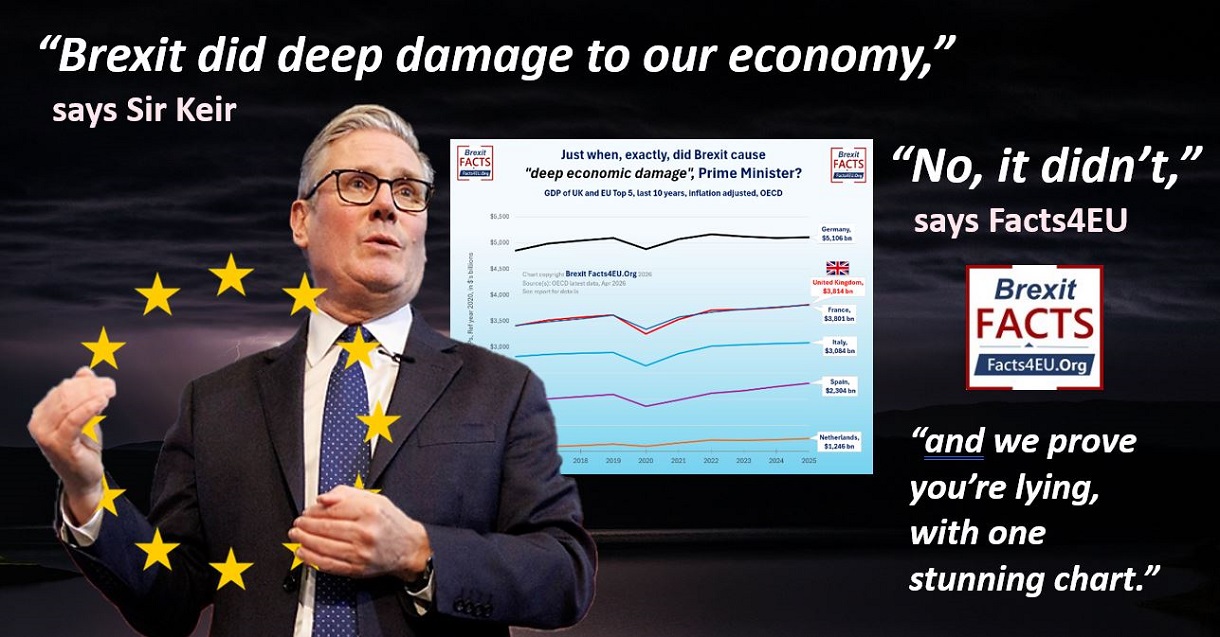
“Brexit did deep damage to our economy,” says Sir Keir
“No, it didn’t,” says Facts4EU,
“and we prove you’re lying, with one stunning chart.”
Montage © Facts4EU.Org 2026
We demand a full public retraction and apology from the PM to the British people
Yesterday we published a report described as “a blockbuster” by a GB News executive, which contained a chart called “stunning” by Reform UK’s Deputy Leader, and as having “nailed it” by a senior Conservative Peer and expert on the economy.
The report was a definitive response to the Prime Minister, the Chancellor, and other Cabinet Ministers who have been repeating the same lie with ever-increasing intensity for months.

The lie:
“Brexit did deep damage to our economy”
Someone had to call them out and it fell to us.
In one, powerful blow to a Prime Minister already under pressure for his veracity over the Mandelson affair, we destroyed the entire basis for his ‘EU Re-Set’, showing it is founded on lies.

Whilst it now seems unlikely he will still be in post for the second of his EU Re-Set Summits, the Government will remain and one of his colleagues who has repeated the same lie will no doubt continue this highly damaging process.
Here is the chart that got everyone talking yesterday
The chart that shows unequivocally
Brexit did NO damage to the UK economy, deep or otherwise
The EU’s Top 5 economies all show the same pattern over the last 10 years
If there was any damage to the UK economy, Prime Minister,
could you please point it out on this chart?
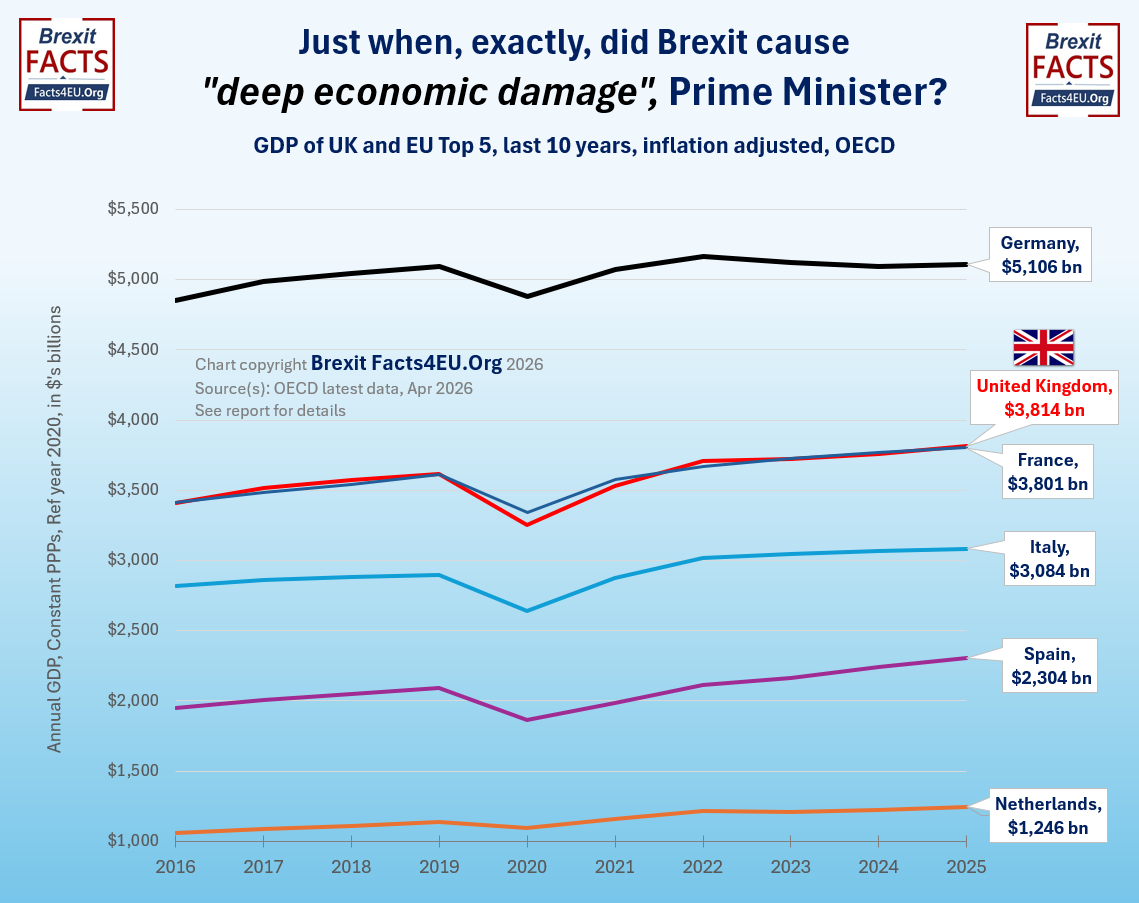
© Brexit Facts4EU.Org 2026 - click to enlarge
[Source(s) : OECD]
The simple fact is neither the PM nor any of his colleagues can defend their lie
Facts4EU is therefore repeating its demand for a full public retraction and apology for misleading the public knowingly and in such an extreme way.
Spreading this far and wide
We invite all readers to use this chart to get the message out and to correct the wholly erroneous view the Government has been presenting to the public.
If you are a private individual, you may go ahead and use it. If you are a business, a group, or an organisation of any kind, then we would like you to email us first so that we can track how much the chart is being used. Thank you!
We have also created the entire box as an image, which you may prefer to use. You can simply click here, right click on it, and then "save as" whatever you want to call it.
To be a full-time, effective voice in opposition to what's happening to our country,
it costs around £15,000 per month.
We receive far, far less than that and really need more readers to step up
Please donate today so we can recruit more staff and make even more of a difference.
Any credit card user
Quick One-off

From £5 - £1,000
Monthly

From £3 per month
Paypal Users Only - Choose amount first
Quick One-off
Monthly
Don't leave this to someone else. You are that 'someone else'.
Observations
We created this chart to be used. Please help to get it out there by whatever means you can - social media or more traditional methods. Do let us know, as we are always interested in hearing from our readers.
Please, please help us to carry on our vital work in defence of independence, sovereignty, democracy and freedom by donating today. Thank you.
[ Sources: OECD | No.10 | No.11 ] Politicians and journalists can contact us for details, as ever.
Brexit Facts4EU.Org, Fri 17 Mar 2026
Click here to go to our news headlines
Please scroll down to COMMENT on the above article.
And don't forget actually to post your message after you have previewed it!
Since before the EU Referendum, Brexit Facts4EU.Org
has been the most prolific researcher and publisher of Brexit facts in the world.
Supported by MPs, MEPs, & other groups, our work has impact.
We think facts matter. Please donate today, so that we can continue to ensure a clean Brexit is finally delivered.
Any credit card user
Quick One-off

From £5 - £1,000
Monthly

From £3 per month
Paypal Users Only - Choose amount first
Quick One-off
Monthly
Something to say about this? Scroll down for reader comments